Spinward Flow
SOC-14 5K
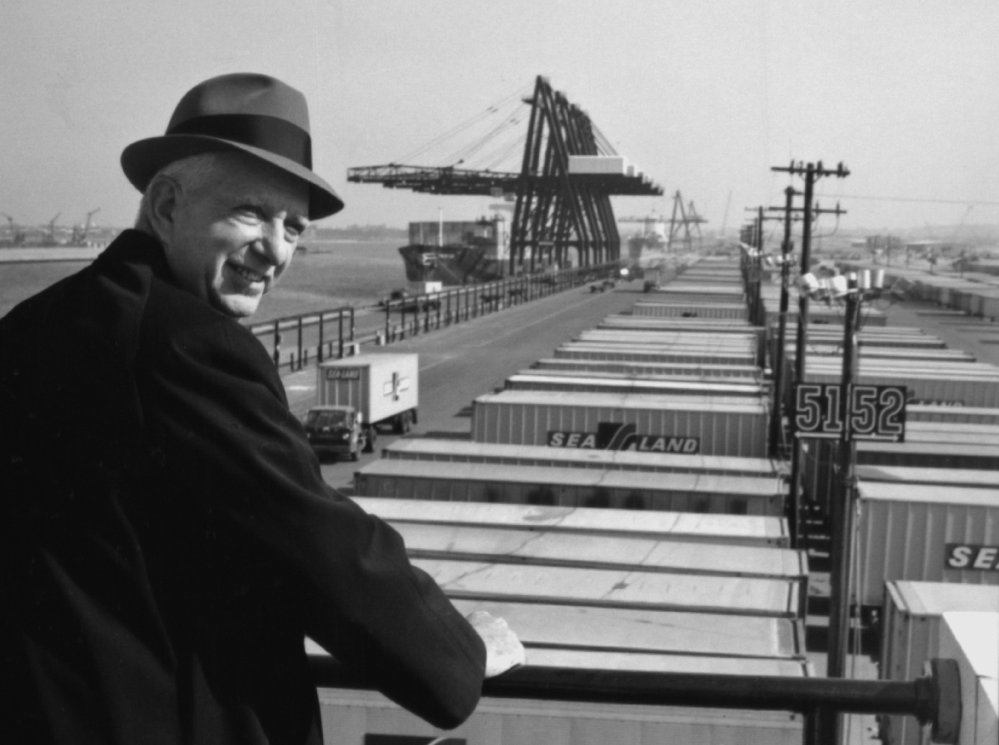
True.By 1975, most new large cargo ships were container-ships.
But there were still plenty of older ships in the inventory and it took a while for the age out/replace process of rolling over into new ships to replace the vast majority of the inventory of ships. Containerization REALLY took off when the older ship designs aged out of service and got replaced with the new container ships getting built around the world in shipyards.
Substantially the same phenomenon is happening right now in the light passenger vehicle market (and is also about to start happening in commercial trucking) due to the economic advantages of electrification and the mass production of battery electric vehicles (BEV). Towards the end of this decade (by 2030) there will be only a fraction of the market for new cars and trucks being built with internal combustion engines (ICE) simply because the BEV option will disrupt demand to the point where economies of scale for ICE go into reverse, making those vehicles uneconomical to manufacture and sell into a MUCH smaller market.
So there's a sort of "overhang" effect involved in displacing/replacing paradigms in the transportation sector, where it takes time before the inventory of legacy vehicles age out of service to be replaced by the newer paradigm models ... creating a transition period before the changeover becomes (more) complete and the economies of scale turn virtuous for everyone who adopts the new paradigm of operations ... until the NEXT technological disruption comes along.
Leaded vs Unleaded petroleum fuel.
Combustion vs Batteries for power plants on land, water and in the sky.
Breakbulk vs Containerization in high volume shipping.
Snail Mail vs Email.
Phone Calls vs Text Messages (and Discord).
Terrestrial Broadcast vs Cable vs Satellite.
I could keep going, but I'd like to think I've demonstrated where I'm coming from with my assertions adequately enough for people to get the gist of why there's a delay from when new standards get promulgated until they finally come into such widespread use as to be ubiquitous. Even if adoption rates follow an S-curve, it still takes time for the transition to play out.


")

")