I looked that up on Wiki, and I still don't understand...
But I learned enough to know that I didn't calculate the Standard Deviation because not only did I not know what that was, I don't really need it for what I needed to know or need to use eventually. Now, I can see the difference between using a 3 4-5 6-8 9-12 13-15 16-17 18 on 3d6 for a -3 to +3 ability modifier versus using 3 4-5 6-7 8-9 10-11 12-13 14-15 16-17 18 on 3d6 for a -5 to +5 ability modifier, and the math behind the curtains that makes the differences understandable.
On the other hand, please feel free to calculate the standard deviation for the die pairs for your own satisfaction and edification, knowledge is power!
Simple way:
open MS Excel, Apple Numbers, Google Sheets, or Libre Office Spreadsheet
enter all the possibilities in a range. Let's say we put 2d6 in B2 to G7 (1-6 across, 1-6 down, cells in middle add them up - in B2, enter
=B$1+$A1 then hit enter
in another cell, =stdev(B2:G7)
Note that B1:G1 is the face values on the first die
A2:A7 is the second die face values.
for 3d, unroll that content into one axis (for 2d6, it's going to be 36 entries as one axis, and the other axis is 1
for 4d, unroll the next 2d on the second axis.
The hard way: find all your permutations of outcomes (which, on 2d6 is 36 different entries, [2, 3, 3, 4, 4, 4, 5, 5, 5, 5, 6, 6, 6, 6, 6, 7, 7, 7, 7, 7, 7, 8, 8, 8, 8, 8, 9, 9, 9, 9, 10, 10, 10, 11, 11, 12]
Subtract the mean (what most call the average) from each to form a new set:
[-5, -4, -4, -3, -3, -3, -2, -2, -2, -2, -1, -1,-1,-1,-1, 0, 0, 0, 0, 0, 0, 1, 1, 1, 1, 1, 2, 2, 2, 2, 3, 3, 3, 4, 4, 5]
Square the members of the set
[25, 16, 16, 9, 9, 9, 4, 4, 4, 4, 1, 1, 1, 1, 1, 0, 0, 0, 0, 0, 0, 1, 1, 1, 1, 1, 4, 4, 4, 4, 9, 9, 9, 16, 16, 25]
Sum them 210, if I calculated right.
Divide by the number of entries ... 36 in this case, giving 5.83̄3̄3̄
Squareroot that (I get 2.415...) more correctly, my calculator shows σ= 2.41522946
For another example: 1d4 and 1d6
2 3 4 5 6 7
3 4 5 6 7 8
4 5 6 7 8 9
5 6 7 8 9 10
unrolling that [2, 3, 3, 4, 4, 4, 5, 5, 5, 5, 6, 6, 6, 6, 7, 7, 7, 7, 8, 8, 8, 9. 9. 10]
Mean x̄= sum/number = 144/24 = 6
Subtracting x̄ from each gets: [-4, -3, -3, -2, -2, -2, -1, -1, -1, -1, 0, 0, 0, 0, 1, 1, 1, 1, 2, 2, 2, 3, 3, 4]
squaring each [16, 9, 9, 4, 4, 4, 1, 1, 1, 1, 0, 0, 0, 0, 1, 1, 1, 1, 4, 4, 4, 9, 9, 16]
Sum of squared array = 100
divide by 24 entries = 4.16͞66͞6
Squareroot gives σ= 2.04124145
Note that the mode is [5, 6, 7], and the median is 6.
In a proper bell curve, the standard deviation describes the points where a "normal" distribution would hit certain points... it's traditionally abbreviated with the greek lowercase sigma: σ
from the range of mean-standard_deviation to mean+standard_deviation (mean is often shown as x̄̄) is 68.27% of the total range of the sample space.
(x̄-σ ⋯ x̄+σ) ≅ 68.27%
(x̄-2σ ⋯ x̄+2σ) ≅ 95.45%
(x̄-3σ ⋯ x̄+3σ) ≅ 99.73%
it gets closer to 100% as the multiplier of sigma rises, but in non-quantized distributions, doesn't ever actually hit 100%.
Very few things are perfect to the standard distribution aka gaussian distribution, and dice rolls are NEVER actually gaussian...
A standard distribution assumes both axises to be continuous; dice are quantized, and normally represented by integers. (yes, that is an intentional pun) But 3d or more become closer and closer as to gaussian.
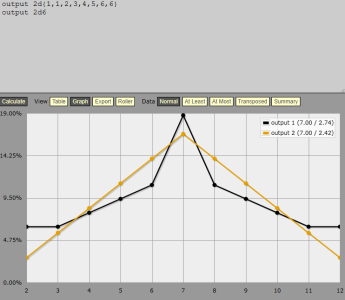
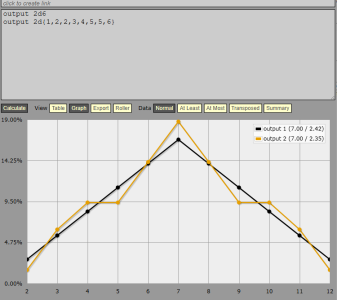
There are several measures of central tendency: mean, median, and mode are the major ones; standard deviation is pretty meaningless without the mean and the range. Given the two, however... it can tell you about the data. For example, 1d4+1d6 is a pretty bad fit to gaussian. Nice wide flat spot.
One fun thing I tried, once, was a once-shot of MT, but using 1d4+1d8 instead of 2d6... nice wide flat spot...played just fine.

